Standard reports on inventory balances in the 1C: Trade Management program, ed. 10.3" do not in any way signal the user about the need to order any product.
Moreover, if during the reporting period there were no movements for the product (i.e. there is no opening balance, income and expense), then the product will not be shown in the report at all!
To always maintain optimal balances of goods in the warehouse, you can use the “Order Point” mechanism. The essence of the mechanism is that you indicate in the program the minimum quantity of goods that should be in stock. After this, in a special report, the system will show the product that needs to be ordered and calculate the required quantity.
Setting order point values
Indication of the minimum balances of goods in the warehouse is carried out in the document “Setting order point values”.
Menu: Documents - Planning - Setting order point values.
Let's create a new document using the "Add" button. The document indicates all the products whose optimal quantity you want to support. For each line fill in:
Characteristics - indicated if the product has characteristics (colors, sizes, etc.).
Method of determination - method of calculating the minimum and optimal balance. Choose one of 4 methods:
Fixed - values are entered manually by the user.
Average lot size - values will be calculated based on the average volume of goods purchased.
Optimal order size - values will be calculated based on product sales.
Do not control - values are not specified, the remainder is not controlled.
Order point values are the optimal quantity of goods for the “Fixed” method.
Safety stock is the minimum quantity of goods for the “Fixed” method.
% of the order point value - the percentage that will be used to calculate the optimal quantity (for the “Average lot size” and “Optimal size” methods).
% of safety stock - the percentage that will be used to calculate the minimum quantity (for the “Average lot size” and “Optimal size” methods).
Warehouse - you can specify a warehouse whose balances will be controlled. If the warehouse is not specified, then the total balance in all warehouses will be monitored.
Example of a completed document:
Order point analysis
To analyze warehouse balances and the need to order goods, use the “Order Point Analysis” report.
Menu: Reports - Purchasing - Purchasing analysis - Order point analysis
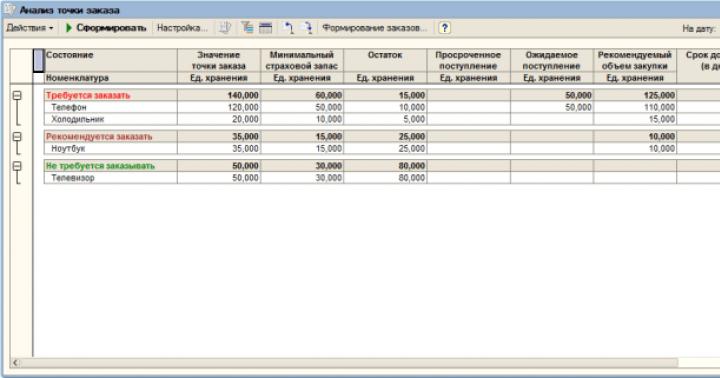
The report for each product displays the following information:
Order point value - optimal quantity in stock (from the order point setting document)
Safety stock - minimum quantity in stock (from the order point installation document)
Remaining - current balance of this product
Overdue receipts - the expected quantity of goods that were not received on time
Expected receipts - the expected quantity of goods whose delivery date has not yet arrived
Recommended purchase volume - the quantity of goods recommended by the program that needs to be purchased. It is calculated as the optimal quantity minus the current balance. Products ordered do not reduce this quantity, as the order may not arrive.
Delivery time (in days) - average delivery time of the supplier

The program divides all products into three categories:
No need to order - the remaining product is more than optimal, no need to order. For example, the balance of TVs is 80 pieces, and the optimal quantity is 50 pieces. There is no need to order TVs yet.
It is recommended to order - the remaining product is less than the optimal quantity, but more than the minimum quantity. This means that the goods need to be ordered, but the timing is not critical. For example, the balance of laptops is 25 pieces, which is less than optimal, so the program recommends purchasing 10 pieces (up to 35 - the optimal balance). At the same time, the minimum balance (15 pieces) is still maintained.
Need to order - a product whose balance is less than the minimum value needs to be ordered urgently. For example, the minimum balance of phones in stock is 50 pieces, but there are only 10 pieces in stock. The product urgently needs to be ordered, and the program recommends purchasing 110 pieces at once (up to 120 - the optimal quantity).
Note: to fill in the delivery period, you need to indicate the main supplier and indicate its delivery date. The main supplier is filled in in the product on the “Additional” tab. The delivery time is indicated in the counterparty card on the “As a supplier” tab below.


Ordering necessary goods. Warehouse replenishment
You can create orders for the necessary goods directly from the report using the “Order Formation” button.

A form for creating orders will open:

The form lists all the products whose balances we are tracking. Products are divided by main suppliers; accordingly, orders will also be created for main suppliers.
Ordered quantity - the quantity of goods that has already been ordered, but has not yet arrived
Order - the quantity that will be added to the order (the difference between the recommended and ordered quantities)
You can change the quantity in the “Order” column at your discretion.
By clicking the “Run” button, the program will create an order for each supplier.
On the “Orders to Suppliers” tab you can view all created orders:

You can open (double-click) each order, post it, print it, or delete it if it was created by mistake.
Order example:

After creating and posting orders, all ordered goods will be reflected in the report in the “Expected receipt” column:

Not only an accountant needs to know the number of goods in stock on a specific date; such information is needed for planning purchases and controlling sales. You can generate a reporting sheet in the software package “1C: Trade Management edition 11.0”, “Taxi” interface in several ways; in addition, the settings allow you to display not only the total quantity of the item, but also analyze the inventory in a specific warehouse cell, clarify the movement of goods for period including reserve. Before you look at the balances in the warehouse in 1C, you should determine which report will be more convenient to do this with.
Overview of warehouse reports
All main reports regarding product balances are located in the “Warehouse and Delivery” tab.
Each report is designed to present information differently. To decide how to view warehouse balances in 1C, let’s consider all the features of analytical forms. To select the required report, you need to open the tab with the left mouse button and generate indicators by clicking the corresponding button.
All tables can be printed, you must first open the window in viewing mode, and also save to a file or send by e-mail. Let's consider the features of the formation of each reporting form for viewing warehouse balances.

List of goods movement in the warehouse
In this table, you can clarify not only the balances of goods in the warehouse, but also their movement for a certain period of time or as of the date of the report.

The “Warehouse balances” report generates the quantity of items for all storage addresses by default, if a specific warehouse is not selected. In the “Settings” tab, you can check more detailed inventory analytics.
- In the “Selection” tab, use the “Selection” button to configure the generation of a report on a specific product item, product range, or product groups;

- In the “Fields” tab, you set the analytics parameters for the formation of warehouse balances. To do this, you need to check the cell in the left field, then use the arrow to move it to the right field. The hierarchy order in the right margin is formed by the arrows at the top of the panel. With their help, you can prioritize the reflection of product items.
To prevent unnecessary information from being reflected in the reporting form, you can uncheck the box in the left field;
- After selecting analytics, you need to create a report on the balance of goods in warehouses by clicking the “Close and generate” button.

To search for a product item in the generated report on product balances, use the “Find” button. This is a convenient search if the company has a large inventory of inventory. The analysis can be performed not only by the full name of the product; it is enough to enter part of the word.

The settings for the “List of goods in warehouses” report are configured in the same way. It is formed for the enterprise as a whole or for each specific warehouse; you can also set any period for data reflection.

By double-clicking the left mouse button on the quantitative balance or movement of goods, you can open the income or expense analytics.

Warehouse inventory turnover
This report generates inventory analytics. The form is intended to determine balances, control their movement, identify low-turnover groups, in addition, it can be used to estimate the quantity of items for the items of interest.

In the “Settings” tab, you can select the following parameters.
- Analysis of turnover of commodity items for a certain interval;
- Type of price - the analysis will be generated only in relation to wholesale, retail, dealer or other types of prices that are provided at this enterprise;
- Stock;
- Type of nomenclature;
- Classification type;
- In the “Selection” tab, if necessary, you can sort the analyzed positions.
After you finish selecting the settings using the “Close and Generate” button, the reporting data will be reflected on the screen.

Remains and availability of goods
This report generates balances for the warehouse or the enterprise as a whole only as of the current date. It is designed to analyze the following data.
- Quantitative balance of goods;
- Reflects the number of positions placed in reserve. They are highlighted in red and have a negative value;
- Available balance, which is calculated taking into account the goods in reserve;
- Expected amount of income and expense;
- The expected quantity of goods for a given date, taking into account the reserve, income and expense;
- Available quantity of goods by dates. It may change as new documents are processed.
All settings are made in the appropriate tab; the selection principle is similar to previous reports. After selecting analytical data, the report is generated using the “Close and Generate” button.

Similar data can be performed in the “Commodity Calendar” report; it analyzes balances for specific dates, taking into account the receipt of goods, sales and reserves. The program will also tell you which items are already expired.

Report “Statement of item series”
This form allows you to clarify the movement and quantity of a specific product item. This may be necessary, for example, to identify controversial issues regarding the quality of a product or batch, shipment and remaining defects.
In setup mode, you need to select the following options.
- Data analysis period;
- Product item;
- If necessary, you can narrow the search by filling in the “Series” and “characteristics” fields of the product. This is doable provided that the data was initially entered into the item card.
Using the “Close and Generate” button, the reporting form will be displayed on the monitor.

Remaining goods by expiration dates
In this report, you can control inventory taking into account expiration dates. This is a convenient report not only for food residues, but also for cosmetic products, household chemicals, pharmacology, and veterinary medicine. To do this, in the “Settings” tab, you must first select the expiration date, the limit of which should be monitored.
- Expired products;
- 0-20%, 20-40%, 40-60%, 60-80% left before expiration;
- View perishable product items, as well as items with an expiration date of more than a year.
Information about the expiration date must be entered manually into the product card upon arrival. For a detailed analysis, the report allows you to select a narrower category of inventory, as well as identify a specific warehouse for selecting analytics.

Inventory in operation
The report allows you to quickly generate information about product items transferred and returned by employees or other individuals. The program provides analytics for the following positions.
- Analysis of balances in relation to all individuals or allows you to select a specific person;
- Analysis of the balances of the entire product range or a separate product item;
- Clarify the status of production of an item's resource.
The “Close and generate” button will display the report on the screen.

Conclusion
You can view product balances in the “1C: Trade Management version 11.0” program, “Taxi” interface using various reports, the data is generated not only in quantitative terms, but also in total. In addition, expanded forms help analyze the movement of items throughout the enterprise, at a specific warehouse, or just one product item. The software package will tell you which goods are reserved, this is convenient if several people are involved in shipment.
The user needs to receive data on the balances of goods in the context of warehouses, and the initial data should be taken from the advanced cost accounting registers for accounting. The appearance of the report is shown in the following screenshot.
In order to understand what query needs to be written for the ACS data set, consider the structure of the tables in which data on advanced analytics is stored.
Information sources
Since we will receive the balances of goods according to accounting data, we are interested in the corresponding accumulation register “AccountingCostRegl”. But we won’t simply get information about the remainder of the nomenclature from it. The register dimensions are cost analytics keys, and not the usual elements of the reference books “Nomenclature”, “Item Series” and so on.
An analytics key is an element of the corresponding directory for which various combinations of accounting views are stored. The wording is general, so for better understanding I will provide the following screenshot:

From the figure we see that the register dimensions contain directory elements for the corresponding accounting section (accounting type, costs, batches and cost distribution). If we make a request to the remainder of the "CostRegl" register, then we will not be able to establish, for example, selection by item or warehouse. We will only have access to selections based on the analytics element. The latter is very inconvenient.
In order for us to be able to set selections in the usual way, we need to attach information registers for each of the analytics sections to the cost accounting table. Each such information register contains a "Link" resource that refers to the accounting analytics key directory. The values for the analytics key ("Organization", "Warehouse", etc.) are stored in the dimensions of this register.
In the screenshot, I noted the dimensions “Warehouse” in the “Accounting Type Analytics” register and “Cost” in the “Cost Accounting Analytics” register. The "Cost" dimension stores a link to the reference book element "Item".
VERY IMPORTANT to remember that when receiving only balances by item, and indeed making any report, you need to make a selection according to the accounting section in order to obtain correct data. In our case, we need to set the selection to the “Accounting Section” dimension of the “Accounting Type Analytics” register by the “Inventory of Inventory” value of the “Accounting Sections” enumeration, since it is this accounting section that stores data on item balances in warehouses.
Request and SKD
And so, the general scheme for storing RAUZ data must now be clear at a level in order to write a report on the balances of the item in the context of warehouses. When creating a report on the access control system, we first decide on the request. I created it as follows:
Request = " SELECT ALLOWED | |PLACE Analytics By Accounting Sections |FROM | Register of Information. Analytics of an Accounting Type AS a RegisterAnalytics of an Accounting Type|WHERE | RegisterAnalyticsAccountingType. Accounting Section = & Accounting Section |; //////////////////////////////////////////////////////////////////////////////// |SELECT ALLOWED | RegisterAnalyticsAccountingType. Warehouse AS Warehouse, | Cost Accounting Analytics Register. Cost AS Nomenclature, | Cost AccountingReglRemains. Quantity Remaining AS Remaining |FROM | Accumulation Register. Cost Accounting Reg. Leftovers( | , | Analytics of Accounting Type B | (SELECT VARIOUS | RegisterAnalyticsAccountingType. Link | FROM | AnalyticsBy Accounting Sections HOW RegisterAnalyticsAccounting Type) ) HOW Cost AccountingReglRemains | (LEFT CONNECTION Register of Information. Analytics of an Accounting Type AS Register of Analytics of an Accounting Type | Cost Accounting SoftwareReglRemains. Accounting Type Analytics = Accounting Type Analytics Register. Link) | (LEFT CONNECTION Register of Information. Analytics of Cost Accounting AS Register of Analytics of Cost Accounting | Cost Accounting SoftwareReglRemains. Cost Accounting Analytics = Cost Accounting Analytics Register. Link)" ;
In the first request, we receive cost accounting analytics for the accounting section "Inventory" and place the result in the temporary table "Analytics by Accounting Sections". Next, we make a request to the virtual table of balances of the accumulation register "AccountingCostRegl", in the parameters of which we indicate the condition for selecting according to the analytics of the accounting type for the values in the temporary table "AnalyticsByAccountingSections".
Now the most interesting thing - we attach the information registers “Accounting Type Analytics” and “Cost Accounting Analytics” to the table of balances:

As selectable fields, we set the "Cost" (Nomenclature) field from the "Cost Accounting Analytics" information register and the "Warehouse" field from the "Accounting Type Analytics" information register. The quantitative indicator of the balance is stored in the "Quantity" resource, which we take from the "Cost Accounting Reg" accumulation register.

Don't forget to set the value of the "Accounting Section" parameter to the value "Enumeration.AccountingSections.Inventory" on the "Parameters" tab of the data composition scheme.
Result
As a result, we received a working report on item balances using the advanced cost accounting analytics register. Of course, it does not have extensive functionality (characteristics, sections by organization, and so on), but as an example that explains the general principle of developing reports for RAUZ, it is just right.
Question: How to form warehouse balances in quantitative and total expressed in prices of receipt in the configuration Trade management 11?
In the “Inventory and Purchases” section on the left in the navigation panel, you need to select “Inventory and Purchasing Reports” and among the reports in the Purchasing and Returns section, find the Product Cost Analysis report.”
 The report window contains two main areas, let's call them “Settings Area” and “Report Area”.
In the settings area, you can set the reporting period, as well as the composition and order of grouping of indicators that will be displayed in the report.

To select a period, you need to check the “Period” line, and in the field on the right select the desired period option from the list (This month, This decade, etc.). If you need to set a custom period, you need to select “Custom period” at the very top of the list and set the period in the window that appears.

In the same way, you can limit the display of information by Organization, Warehouse/Partner, Item.
To change the report grouping, in the Settings Area, in the Grouping line on the right side, click on the edit button (with three dots)…

and in the window that appears you can change the grouping fields.

For example, move the Warehouse grouping above Items, then we will first generate totals and a list of items, first for one warehouse, then for another, etc. (see picture)

We see that the report displays numerical indicators for the Beginning of the period, Income, Expense and balance at the End of the period. If, for example, you need to see only the final balance in the report, then other indicators can be disabled.
To do this, click the “Settings” button above the settings area and in the window that opens, open the “Selected fields” line for editing.

In the window that opens on the right side, you can disable unused indicators. Moreover, you can disable both an entire group of indicators by unchecking the flag from the group itself (see point 1 - group Initial balance), and each indicator separately in any group (see point 2 - indicator Purchase price). When you finish editing the fields, you need to click “OK” in the current window, and in the “Report Settings” window, click the “Finish editing” button.
Suppose we are only interested in the “Final Balance” group with the indicators “Quantity, Purchase Cost, Additional. expenses, cost price. In this case, the report will look like the one shown in the figure.

Don’t forget to update the report every time you complete any settings by clicking the “Generate” button.
You can save this setting in a new report version so that you do not have to make these settings each time. To do this, click the “All actions” button and select “Save option”. The Save Report Option Wizard will open. You can save all the settings in an existing report version, or create a new report version (I recommend creating a new one).

To create a new report option, you need to select the appropriate line at the top of the window and click “Next”, in the next window, enter the name of the report option in the “Name” field and click the “Save” button.

This option will be saved in the general list of report options, which is available for selection using the “Select option...” button. To select your option, after opening the report, click “Select option...”

and double-click to select your saved version of the report, and then, as usual, click on the “Generate” button to get the report results.
allows you to obtain information about the quantity of goods and ready-made dishes in the warehouse on a certain date, control balances and replenish stocks of goods, identify expired products, and correct negative balances.
How to work with the report
By default, the report shows the warehouse status for the current day. To obtain information on product balances for another date, enter it in the field View balances as of date and press the button Update .
You can open several different report windows, for example, with different products.
To get information about balances for a specific product, just type its name in the field Search by product .
From this report you can open a report on the movement of goods and a balance sheet.
If the report is built for a past period, then it displays all products, even those deleted, if their balance on the selected date was non-zero.
To select warehouses for which you want to obtain data, click the button Stock and in the list that opens, check the boxes next to their names (by default, all warehouses of the enterprise are selected).
Reporting data can be detailed by warehouse or item groups: to select a report option, use the View button.
The balance report can be customized:
- Sort data by most parameters (or several parameters at the same time),
- Perform grouping, including multi-level,
- Filter data by most parameters (or several parameters),
- Show or hide options.
Setting up a report is similar to setting up other reports in the iiko system, for example, see the description in the Products and warehouses section.
Control of balances and replenishment of stocks
Using the balance report, it is convenient to monitor the availability of all necessary products and ingredients in the warehouse and create an order for the supplier (receipt note) to replenish stocks.
To control the balance of goods by stock levels at the point View select item Consolidated report. Then the table will display columns with the minimum and maximum quantities of goods in warehouses.
To see which products are running low, select the value in the Remaining criterion list Less than minimum. In this case, only those products whose balance satisfies this restriction will remain in the report.
Similarly, a report on goods whose quantity is excessive is generated according to the criterion More maximum .
Product cards must first indicate inventory levels: minimum and maximum on the tab Additional Information .
Identification of expired products
Using the report, you can identify and promptly write off products that have expired at the time of viewing balances. To do this, the product cards must first indicate shelf life on the tab. Additional Information .
Select from the list Residual criterion as an option Expired products, products for which the specified expiration date has expired will be displayed.
For example, let the shelf life of a cake be two days. The current balance of cakes is 8 pieces. 2 invoices were issued for the goods: yesterday – for 5 pieces, and three days ago – also for 5 pieces.
Thus, there are expired products in the warehouse - remnants of goods from a batch that arrived three days ago.
Correction of negative balances
The iiko system allows you to maintain inventory records with the formation of negative balances of goods or dishes in the warehouse. Positions that have negative balances are highlighted in red in the report.
However, it is necessary to understand that a negative balance is a signal that something was done incorrectly, or that errors are being made systematically.
The ability to work with negative balances is determined by access rights and system settings on the tab Accounting settings .
To find out what led to this situation in the warehouse, you can open the goods movement report.
Collation statement
If there were no errors or they have all been corrected, but a negative balance remains, then it must be compensated using comparative inventories.
Purchase Invoice
Another way to correct negative balances is to create a receipt for goods that have gone negative directly from the Warehouse balances report.
Select products with negative balances in the list and from the group in the context menu Negative balances select one of the commands. As a result you can create:
- Receipt invoice with zero prices (the function is available when viewing balances in any form).
- Receipt invoice with prices at cost (the function is available only when viewing balances in the form of a summary report).
You can also copy information about a product with a negative balance to the clipboard in order to create the necessary warehouse document for it. The command for this is Actions → Negative balances → Copy to clipboard .